The funny thing is, I haven't used that MathCAD sheet that often. It had some weird behaviour in some cases, where the plot wasn't continuous. That looked horrible. And it turned out to not be as practical as I hoped, since searching for strains using given N and M combinations turned out to be quite processing heavy.
However, I was looking into Python more and more the last years. I had used it some when doing earthquake engineering around 4 years ago or so, since the FEM package Diana FEA we used at HaskoningDHV started using it as input language with the release of version 10 back then. But lately Python has gotten a lot of attention, so I started to investigate it again some more about a year ago I think?
Python notebooks
That's when I learned of JupyterLab, a browser based Python programming environment in which you can create so-called "notebook": snippets of code you can write, rearrange, supplement with markdown, etc.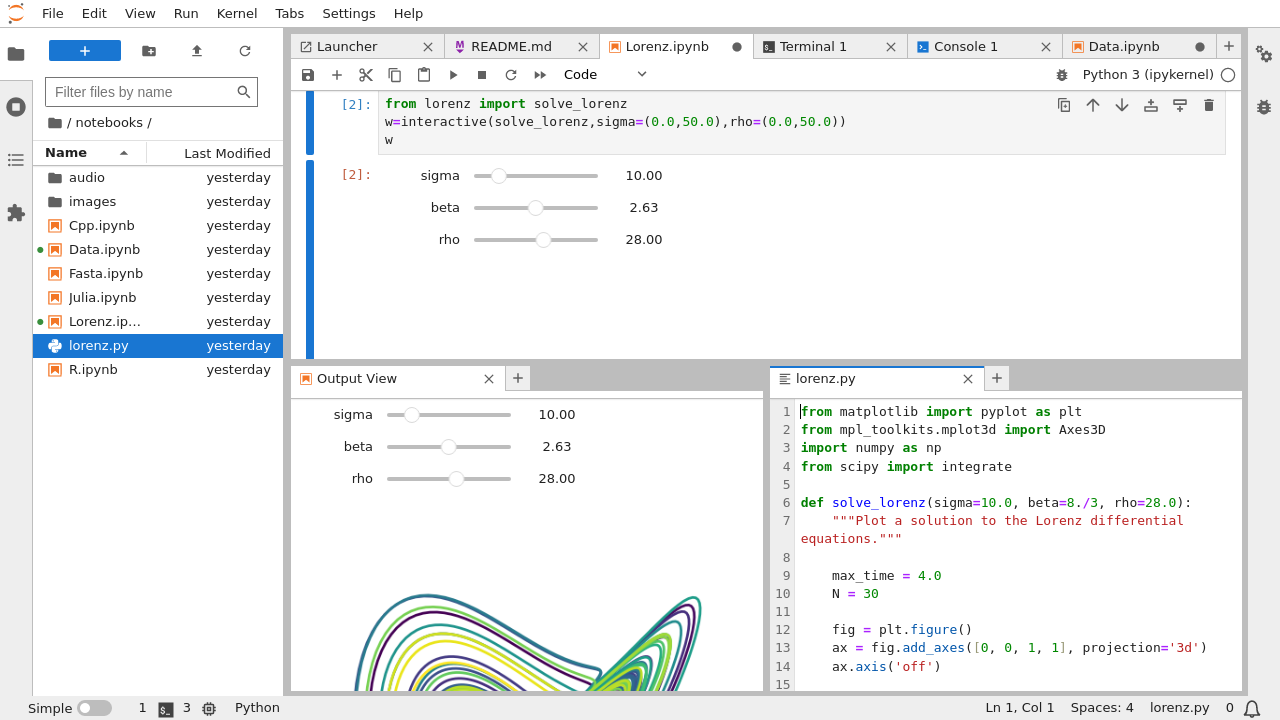 |
| Example screenshot from the Jupyterlab website |
It's versatility really surprised me to be honest! I am even starting to use MathCAD (paid software) less and less, in favor of Jupyterlab for my day-to-day calculations, although I still have to pay more attention to making my calculations better readable ;-) But it's got all the power of mathematics that MathCAD has (in libraries/packages like NumPy, SciPy, etc.) combined with the versatility of a programming language to make more powerful tools. I also think it's faster in compute-heavy calculations, but I haven't tested that yet.
Getting started
I first started with creating some basic sheets, just to get the gist of it: a simply supported beam, torsional buckling of an I-shaped beam, that sort of things. Then I started to replicate my MathCAD sheet for calculating the critical steel temperature for columns. I will not go into the code too much, you can check it here, but the result is quite nice, and very versatile!
(And for code sharing, you can use Github's Gist! See link above)
Onions again
Back to the onions. The last couple of months I have been working for a Stufib study group focusing on plasticity of concrete sections. For this, I was looking to automatically calculate the bending moment vs. the section curvature (M-Kappa diagram) for a section at different load levels. These combinations of axial load (N) and bending moment (M) are not on the M-N capacity curve of the "onion", but inside. And like I said, that had turned out kind of difficult in MathCAD. So I tried Python...
The basics for the tool/sheet/code are similar to the one in MathCAD, so for an explanation please see my blog on the MathCAD version of the onion.
I created some functions for the onion


And beautiful onions are the result:

Next step was creating functions again, this time for drawing a M-Kappa curve at a given axial load:


Nice to know: solving capability is supported already in Python (via the SciPy package), so no writing our own Newton-Raphson iterations required. Yeah!
Then it's programming a pretty graph in Python, et voilà:

M-Kappa curves on steroids
This is nothing new, lots of software in the market already who do this flawlessly (and mind you, mine is not completely flawless yet, but a good enough proof of concept). But here comes the good stuff: after this all you need is some looping magic and you can take these calculations to a whole new level. You just have to...... create a range of axial loads to calculate ...

... determine the plastic and elastic bending moments at the given axial loads ...

... and calculate a range of increasing bending moments with their respective curvatures, using some Python solving qualities...

... and you will end up with another nice graph! One that those fancy commercial software packages cannot produce!


Conclusions
After playing with it for a while now, I've written some of my findings of using Python in Jupyterlab vs. MathCAD down below as a small comparisson.Python/Jupyterlab Pros:
- Very powerful
- Fully customizable graphs
- Markdown (HTML & LaTeX style formatting of text, in both cells and graphs)
- Free!
- Easy-to-write
- Easy-to-read AND check (the math written is the math calculated)
- No programming experience required
That's it for this blog! The full code for both the (M)N-Kappa calculations can be found here on Github, for those interested in taking a closer look at the (proof-of-concept!) Jupyterlab Notebook code.
If you have any questions, or comments (the code is far from perfect!), please let me know!


